Twitter

Showing posts with label GI. Show all posts

srvctl add oraclehome

Recently I was installing some new databases homes on some Exadatas and I was wondering how the Homes were "known" by the cluster (indeed, when rac-status.sh shows the Homes, I got them as a characteristic of a database and not from a list of registered homes) and I then found this srvctl add oraclehome option. This was on a 12.2 GI and honestly I never noticed it before.

The command help looks like this:
[root@exadatadb01]# srvctl add oraclehome -h
Adds the Oracle home resource to the Oracle Clusterware.
Usage: srvctl add oraclehome -name  -path  [-type {ADMIN|POLICY}] [-node ]
    -name               Identifier for the Oracle home resource
    -path               Oracle home path
    -type               {ADMIN|POLICY}      Type of the specified Oracle home. Default is POLICY.
    -node               Comma-separated list of nodes in which the Oracle home will be available
    -help               Print usage
[root@exadatadb01]#
I then tried to add my new home in my cluster and could check it:
[oracle@exadatadb01]$ srvctl add oraclehome -name TEST -path /u01/app/oracle/product/12.2.0.1/dbhome_2 -type admin -node exadatadb01,exadatadb02
[oracle@exadatadb01]$ srvctl config oraclehome -name TEST
Oracle home path: /u01/app/oracle/product/12.2.0.1/dbhome_2
Oracle home name: test
Oracle home type: ADMIN
Node list: exadatadb01,exadatadb02
Shared: FALSE
Oracle base: /u01/app/oracle
Databases configured:
Listeners configured:
Oracle home test is enabled.
Oracle home resource is individually enabled on nodes:
Oracle home resource is individually disabled on nodes:
[oracle@exadatadb01]$
And we can have information about this home using crsctl as well:
[root@exadatadb01]# crsctl stat res -p -w "TYPE = ora.home.type"
NAME=ora.test.home
TYPE=ora.home.type
ACL=owner:oracle:rwx,pgrp:oinstall:rwx,other::r--
ACTIONS=
ACTION_SCRIPT=
ACTION_TIMEOUT=60
AGENT_FILENAME=%CRS_HOME%/bin/oraagent%CRS_EXE_SUFFIX%
. . .
Cool, huh ? now the question is "what is the use of that ?" indeed, I have checked on the other RAC/GI systems I have handy and no ORACLE_HOME is registered in the clusters, not in any configuration. We could also wonder what would be the use of having an ORACLE_HOME registered in the cluster ? an ORACLE_HOME is just some files and directories in a filesystem, what could be the value of CRS knowing about the ORACLE_HOME ? I then tried to google and MOS about this srvctl add oraclehome command and I absolutely found nothing !

As I do not like to keep things I do not understand their use, I decided to unregister my TEST ORACLE_HOME to keep a clean cluster configuration:
[oracle@exadatadb01]$ srvctl remove oraclehome -name TEST
Which worked fine. Then I thought I could do more testing on this feature and registered my home again:
[oracle@exadatadb01]$ srvctl add oraclehome -name TEST -path /u01/app/oracle/product/12.2.0.1/dbhome_2 -type admin -node exadatadb01,exadata02
PRCS-1085 : Server category test already exists 
PRCR-1086 : server category test is already registered
Which didn't work as it seems that the srvctl remove oraclehome left some categories behind which I found no way to remove (yet). A MOS SR gave me the information that I was hitting this bug:
Bug 25978527 - LNX64-12.2-SRVCTL:SRVCTL REMOVE ORACLEHOME SHOULD ALSO REMOVE CATEGORY CASCADELY 
. . . which I can acces no information about it so I don't know if there is a patch or a workaround for this.

To sum that up, I am not sure about the use of registering an ORACLE_HOME in the cluster, I found no information about this nowhere (google, MOS) and ... the remove oracle_home does not work properly so ... let's say that this feature is good to know and let's see if it becomes a real new feature in the future ! Let me know in the comments if you have a clue about a potential use of this.

An interesting point here though is that CRS not being aware of the ORACLE_HOMEs, GI is then also not aware of the versions of the ORACLE_HOMEs running there and then the pre-requisite saying that GI version has to be >= DB version cannot be enforced by GI -- which I tested and I can assure that it is indeed the case and you can run a DB Home version > GI version with no issue -- well except that it is not supported but it works with no problem as GI is not aware about the DB Home version :)

rac-status.sh : an overview of your RAC / GI 11g,12c, 18c ,19c, 21c, 23c resources in a glimpse


Consolidation has been a fancy word and concept for years in IT resulting for us DBAs with more and more databases and instances running on more and more powerful / bigger clusters running RAC (Real Application Cluster) before and now GI (Grid Infrastructure) from 12c version.

It is kind of nice to have to manage all these big clusters / appliances but sometimes what was easy before become less easy like quickly answering these questions :
  • what is up ?
  • what is supposed to be up ? (which is fairly different from the previous one)
  • where is it up ?
  • have we missed a problem ?
And quickly answering these questions on a Full Exadata Rack with 100 databases running on is not that easy with the common tools.

I then made a tool to be able to answer these questions and have a nice result in a glimpse (please note that all the below screenshots come from real implementations, I have just anonymized the outputs for obvious reasons.

Feel free to also check the the rac-status.sh: FAQ and the rac-status.sh what's new post. You can download the script here, there are download links for each script in the "Scripts" menu on top of each page.


Overview

Please find below an overview of the rac-status.sh script on an Exadata X8-2 half rack :

You will find in this output :
  • The Exadata model (if available, if not, it shows nothing) or nothing for a non-Exadata RAC
  • The first column on the left contains the names of the databases running across the cluster; please note that this column is auto adaptive if you have long database names
  • The second column contains the version (grabbed from the ORACLE_HOME path, the GI has no information on the installed version) and you will find a number "(1)" which refers to the ORACLE_HOME path the database is running against. You will find the ORACLE_HOME list below the table, it is very handy when you have many ORACLE_HOME installed
  • The next columns are the status of each instance on each node (one column per node), a blue hyphen "-" shows that the instances are not there because they are not supposed to be there, the status are quite self explanatory and colored
  • Last but not least, the "DB Type" column shows if the database is a RAC, a RACOneNode or a Single instance. This column can also be colored in White if the database is a Primary database or in Red if it is a Standby database.
  • The owner and group of the ORACLE_HOME which is very handy when you have different owners.


A large implementation

Please find a screenshot of a large implementation; I have removed half of the databases running there as it was not fitting my screen but you can see here a nice and clear output of this full Exadata rack in no time


Please note that here, 4 ORACLE_HOMEs are installed, the reference number in the Version column shows how useful it is in this scenario.

Different DB Types

Here is an example of an implementation with RAC and RACOneNode database types (you may also find some Single instances.


Identifying issues 

This clear output of the status of all your cluster instances is also really helpful to quickly see if something wrong happened as shown in the below screenshot :


Please note that this screenshot output is slighlty different than the previous ones; Indeed, the ORACLE_HOME references in the Version column were not implemented when I took it and as it is not really easy to crash some databases just to renew my screenshots, I am still using it.

Listeners

rac-status.sh can also show the listeners:
Note: if your listeners listen on many ports, the port list is written on the right outside of the table to keep everything visible and well aligned.

Services

rac-status.sh can also show the services:


Tech resources

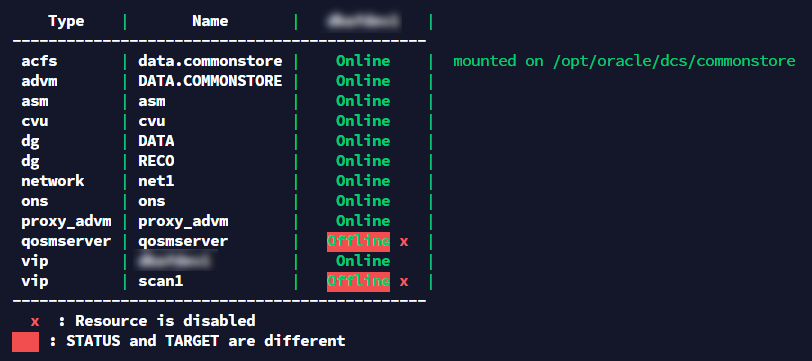
The "tech resources" (diskgroups, VIPs, ACFS, ONS, etc ...) are also shown (option -t which is included in the -a option which shows everything):

If you use ACFS, the filesystem where ACFS is mounted on will also appear on the right on the table as shown on the below example:


Quickly detect a recently restarted resource

rac-status.sh also shows with a yellow background any resource recently restarted which is very handy to quickly see if something wrong has happened in a recent past:

The default shows any resource restarted less than 24 hours ago. You can modify this default in the script with the variable DIFF_HOURS:
DIFF_HOURS="24"
Or in the command line with the -w option knowing that hours is the default unit but you can also use d for day, w for week, m for month and y for year:
$ ./rac-status.sh -w 360        # 360 hours
$ ./rac-status.sh -w 3d         # 3 days
$ ./rac-status.sh -w 1w         # 1 week
$ ./rac-status.sh -w 2m         # 2 months
$ ./rac-status.sh -w 5y         # 5 years

When STATE and TARGET are different

In the case of a resource STATE is different than its TARGET (meaning there is an issue with this resource), it will be highlighted in red with a legend below the table as shown in this screenshot -- not that databases rely on USR_ORA_OPEN_MODE instead of STATE and TARGET (from January 31st 2022 as per the what's new):

Disabled resources

It may happen that resources are disabled, rac-status.sh will then show a "x" next to the disabled resources as well as a legend about this below the table. This is very useful when you enabled and disable some resources during maintenances; it works for listeners, services and instances:

Output customization

The default I ship with the script code is to show the Listeners and the Database by default and not the Services because . . . it suits my needs. As it may not suit yours, you can easily modify this default behavior. You have few ways modifying this to fit your needs.

1/ Modify the default variables in the script:

The default behavior of the script is defined by the below variables so just comment out what you do not want as default in the script (the last uncommented value wins):
  SHOW_DB="YES"                 # Databases
 #SHOW_DB="NO"
SHOW_LSNR="YES"                 # Listeners
#SHOW_LSNR="NO"
 SHOW_SVC="YES"                 # Services
 SHOW_SVC="NO"

2/ Using the command line:

3 options are available from the command line to dynamically change the output:
-d        Revert the behavior defined by SHOW_DB  ; if SHOW_DB   is set to YES to show the databases by default, then the -d option will hide the databases
-l        Revert the behavior defined by SHOW_LSNR; if SHOW_LSNR is set to YES to show the listeners by default, then the -l option will hide the listeners
-s        Revert the behavior defined by SHOW_SVC ; if SHOW_SVC  is set to YES to show the services  by default, then the -s option will hide the services
These variables revert the default behavior. I have coded it like this as it is very efficient. Indeed, the default of the script shows the Listener and the Databases and not the Services. If I want to show the services as well, I just use the -s option.

3/ Show / hide everything:

I have also implemented 2 others handy options:
-a        Show everything regardless of the default behavior defined with SHOW_DB, SHOW_LSNR and SHOW_SVC
-n        Show nothing  regardless of the default behavior defined with SHOW_DB, SHOW_LSNR and SHOW_SVC
These are very handy as whatever the default is, they will erase it. For example, when I prepare the action plan of a maintenance, I want to save the status of every single resource across my cluster whatever the default is, I then write:
$ ./rac-status.sh -a > status_before_maintenance
If you do not know the current default of the script and do not want to bother with it, you can just show the databases only by using:
$ ./rac-status.sh -n -d              # -n shows nothing and -d revert the do not show the database from -n 
You can try many combinations to get used to, it is harmless.

4/ Adapt the colors:

There are also 2 options that may be useful for you depending on your needs. Option -u to show an Uncolored output:


And the -r option to Revert the colors; it is very useful if you are using a clear terminal background:


5/ Sort the database output:

By default, the database output is sorted by database name on a alphabetic order. You can modify this using the -c option.
The -c can receive the below parameters:
c                             # followed by a number for the column number you want to sort by
d                             # to sort by database name
v                             # to sort by version
s                             # to sort by status; it can be followed by a number which
                              # is the node number you want to sort the status by
                              # if no number is specified, it is sorted by the node 1 status
t                             # to sort by DB Type
r                             # can be added to the previous parameters to make the sort reverse
Examples:
./rac-status.sh -c d      # sort by database name (the default)
./rac-status.sh -c v      # sort by version
./rac-status.sh -c vr     # sort by version in reverse order
./rac-status.sh -c c4r    # sort by the 4th column (the node 2) in reverse order
./rac-status.sh -c 4r     # same as above as "c" is default and optional
./rac-status.sh -c s2r    # sort by the status of the second node (same as c4r)
./rac-status.sh -c s      # sort by the status of the first node
./rac-status.sh -c tr     # sort by DB type in reverse order
Few points to keep in mind:
  • Any other option is compatible with -c
  • You can modify the default sort by updating the SORT_BYvariable in the script and then always enjoying your favorite way of sorting the database output like for example:
  • SORT_BY="c3r"      # to always sort by the 3rd column in reverse order
    

grep and ungrep

When you work with big implementations, the rac-status.sh output may exceed the size of your screen (especially when you show the services) and/or you may want to see the specific status of a listener or a database or only the 12c databases, etc ...
I have then implemented 2 options for the purpose of grepping or ungrepping (grep -v) in the rac-status.sh output:
-g        Act as a grep command to grep a pattern from the output (key sensitive)
-v        Act as "grep -v" to ungrep from the output  (key sensitive)
Few examples:
$ ./rac-status.sh -g 12            # Only grep 12c databases
$ ./rac-status.sh -a -g Shut       # Only the lines containing "Shut"
$ ./rac-status.sh -n -l -v Online  # Only the listeners that are not Online
Feel free to test any combination.

Environment setting

By default, rac-status.sh relies on oraenv to set the ASM environment and then access the crsctl command. If oraenv does not work for you, you can use the -e option to use your current environment. Note that the current environment has to give access to crsctl.
You can also set on top of the script USE_ORAENV="NO" instead of the default USE_ORAENV="YES" if you never want to use oraenv and always rely on the current environment.

Usages

On top of using this rac-status.sh script during my daily activities to have a quick look at what is running on a GI implementation, I also found it useful in the below scenarios :

  • Patching progression

rac-status.sh is very useful when patching Exadatas; Indeed, I can then easily follow what's being patched during a database nodes rolling patch (below node 2 is being patched)


  • Before and after a maintenance

I also use this script before and after maintenances (the output is easy to copy and paste) to be able to quickly compare the outputs and see if something is missing at the end of a maintenance, an instance that did not restart properly, etc...
$ ./rac-status.sh -a > status_before_maintenance
. . .  do your maintenance . . .
$ ./rac-status.sh -a > status_after_maintenance
$ diff status_before_maintenance status_after_maintenance
By doing these quick and simple steps, you can ensure being idempotent.
  • A quick monitoring tool

Please have a look at rac-mon.sh for a quick and efficient tool to monitor your cluster based on rac-status.sh.

-h to sum up the options

Feel free to use the -h option to sum up each available option with some examples:
$  ./rac-status.sh -h
NAME
        rac-status.sh - A nice overview of databases, listeners and services running across a GI 12c

SYNOPSIS
        ./rac-status.sh [-a] [-n] [-d] [-l] [-s] [-g] [-v] [-h]

DESCRIPTION
        rac-status.sh needs to be executed with a user allowed to query GI using crsctl; oraenv also has to be working
        rac-status.sh will show what is running or not running accross all the nodes of a GI 12c :
                - The databases instances (and the ORACLE_HOME they are running against)
                - The type of database : Primary, Standby, RAC One node, Single
                - The listeners (SCAN Listener and regular listeners)
                - The services
        With no option, rac-status.sh will show what is defined by the variables :
                - SHOW_DB       # To show the databases instances
                - SHOW_LSNR     # To show the listeners
                - SHOW_SVC      # To show the services
                These variables can be modified in the script itself or you can use command line option to revert their value (see below)

OPTIONS
        -a        Show everything regardless of the default behavior defined with SHOW_DB, SHOW_LSNR and SHOW_SVC
        -n        Show nothing  regardless of the default behavior defined with SHOW_DB, SHOW_LSNR and SHOW_SVC
        -a and -n are handy to erase the defaults values:
                        $ ./rac-status.sh -n -d                         # Show the databases output only
                        $ ./rac-status.sh -a -s                         # Show everything but the services (then the listeners and the databases)

        -d        Revert the behavior defined by SHOW_DB  ; if SHOW_DB   is set to YES to show the databases by default, then the -d option will hide the databases
        -l        Revert the behavior defined by SHOW_LSNR; if SHOW_LSNR is set to YES to show the listeners by default, then the -l option will hide the listeners
        -s        Revert the behavior defined by SHOW_SVC ; if SHOW_SVC  is set to YES to show the services  by default, then the -s option will hide the services
                  Note : the options are cumulative and can be combined with a "the last one wins" behavior :
                        $ ./rac-status.sh -a -l              # Show everything but the listeners (-a will force show everything then -l will hide the listeners)
                        $ ./rac-status.sh -n -d              # Show only the databases           (-n will force hide everything then -d with show the databases)

        -g        Act as a grep command to grep a pattern from the output (key sensitive)
        -v        Act as "grep -v" to ungrep from the output (key sensitive)
        -g and -v examples :
                        $ ./rac-status.sh -g Open                       # Show only the lines with "Open" on it
                        $ ./rac-status.sh -v 11                         # Do not show 11g databases
                        $ ./rac-status.sh -g "Open|Online"              # Show only the lines with "Open" or "Online" on it
                        $ ./rac-status.sh -g "Open|Online" -v 12        # Show only the lines with "Open" or "Online" on it but no those containing 12

        -h        Shows this help
$

Where to download ?

The code is hosted and maintained in my github repository, help yourself and enjoy rac-status !


I hope you'll be enjoying this script as much as I enjoy it on a daily basis !

Any suggestion, comment or bug, please let me know in the comments sections.


rac-mon.sh: a quick and efficient GI 11g,12c,18c monitoring tool based on rac-status.sh

When I recently published a rac-status.sh update, I have been asked if rac-status.sh could also monitor a resource being moved to another node which would mean that something wrong has happened.
As I like to keep things simple and as I really like the below principles from the Unix philosophy:
  • Make each program do one thing well. To do a new job, build afresh rather than complicate old programs by adding new "features".
  • Expect the output of every program to become the input to another
I then found a great opportunity to develop another tool (rac-mon.sh) based on rac-status.sh output to monitor and warn if something wrong happens on a cluster !

1/ Overview

rac-mon.sh compares the current status of a cluster with a previously saved status in a reference file. If any difference is found (meaning something has changed), the user is prompted with these differences and/or receive an email (you can then page someone).
The "reference file" is a file where is saved what is considered in being the "good" status of your cluster (when all the resources are up and running on the nodes you want and with the status you want). Do not worry, rac-mon.sh will be creating it by itself when it first executes.
rac-status.sh -a is used by rac-mon.sh behind the scene.

2/ Pre requisites

The only pre requisite to have is to have rac-status.sh downloaded. It is also good to ensure that rac-status.sh is working properly.
You can save rac-status.sh anywhere, it just has to be known by rac-mon.sh so please update the below variable if you save rac-status.sh elsewhere than in the home directory of the user who execute it.
RACSTATUS=~/rac-status.sh                        # The rac-status.sh script
As mentioned earlier, rac-mon.sh uses a reference file to save the "good" status of a cluster, the default is as below, feel free to modify this path to fit your needs:
REFERENCE=~/rac-status_reference                 # The reference file where is saved the good status of your cluster

3/ A first execution

When you first execute rac-mon.sh, it will be creating the reference file itself and then check if the current status of the cluster is different from the reference one:
[oracle@exadatadb01]$ ./rac-mon.sh
        No reference file found at /home/oracle/rac-status_reference, creating it . . . OK
        No change has been identified across the cluster, all good !
[oracle@exadatadb01]$ echo $?
0
[oracle@exadatadb01]$
Indeed, the first execution will always be a successful one.
Also worth mentioning that the script exits with a value of 0 when no issue is discovered. You can then take advantage of this if you want to schedule rac-mon.sh using any of your already deployed monitoring tool and then integrate rac-mon.sh in your monitoring armada fairly quickly.

4/ Errors detected

You may experience some issues during the life of your cluster and then if some differences are detected, you will be prompted with these difference:
[oracle@exadatadb01]$ ./rac-mon.sh
        The below changes have been identified across the cluster:
8c8
<  LISTENER      | TCP:1521          |          -         |       Online       |   Listener   |
---
>  LISTENER      | TCP:1521          |       Online       |       Online       |   Listener   |
31c31
<  proddb        | app               |         -          |       Online       |
---
>  proddb        | app               |       Online       |       Online       |
[oracle@exadatadb01]$ echo $?
1
[oracle@exadatadb01]$
In the above example, you can quickly see that the LISTENER listener was Online on the first node but is not any more. Also, the production APP service is no more Online on node 1, you can then quickly fix the issue as you know where to search which is always better than having to investigate every component of a cluster.
Also worth mentioning that the script exits with a value of 1 when an issue is discovered. You can then take advantage of this if you want to schedule rac-mon.sh using any of your already deployed monitoring tool and then integrate rac-mon.sh in your monitoring armada fairly quickly.

5/ Warn someone

Finding issues is nice but warning someone to investigate these issues is better. rac-mon.sh can then send emails (with the -e option) when issues are found:
[oracle@exadatadb01]$ ./rac-mon.sh -e
        The below changes have been identified across the cluster:
8c8
<  LISTENER      | TCP:1521          |          -         |       Online       |   Listener   |
---
>  LISTENER      | TCP:1521          |       Online       |       Online       |   Listener   |
31c31
<  proddb        | app               |         -          |       Online       |
---
>  proddb        | app               |       Online       |       Online       |
        Sending en email to     dbaoncall@company.com        . . .  OK
[oracle@exadatadb01]$
I have also implemented a -s option if you want to get an email even if no issue is found:
[oracle@exadatadb01]$ ./rac-mon.sh -s
        No change has been identified across the cluster, all good !
        Sending en email to     dbaoncall@company.com        . . .  OK
[oracle@exadatadb01]$
If you do not want to bother with these options to send emails, you can change the default to always send emails (om failure and/or success) but setting these variables to "Yes":
EMAIL_ON_FAILURE="No"                  # Default behavior to send an email if an error is detected (-e option) - put Yes to always send emails
EMAIL_ON_SUCCESS="No"                  # Default behavior to send an email even if no error is detected (-s option) - put Yes to always send emails
Also, you'd need to set the email(s) address(es) you want to send the alerts to:
EMAILTO="youremail@company.com"        # The email to send the alert to
You can also modify the subject of the emails:
FAILURE_SUBJECT="Error : Cluster status at "`date`      # Subject of the email sent
SUCCESS_SUBJECT="OK : Cluster status at "`date`         # Subject of the email sent

6/ Recreate the reference file

As rac-mon.sh is based on a reference status which contains the good status of your cluster, you may have to update this reference file in a few cases like a service that is now moved on purpose to another node or another database is added to the cluster, etc ... indeed, you do not want to page anyone for a newly added database. You then just have to manually recreate the reference file:
[oracle@exadatadb01]$ ./rac-status.sh -a > ./rac-status_reference
[oracle@exadatadb01]$
And then test rac-mon.sh quickly to double check that everything looks good:
[oracle@exadatadb01]$ ./rac-mon.sh
        No change has been identified across the cluster, all good !
[oracle@exadatadb01]$

7/ Cron rac-mon.sh

You may want to schedule rac-mon.sh on a regular basis to not miss any issue:
*/5 * * * * /home/oracle/rac-mon.sh -e >> /var/log/rac-mon.log 2>&1
Keep in mind to use logrotate to purge this log.
Note that you need to schedule rac-mon.sh on only one node of your cluster.

8/ Option -h for help

As usual, a little bit of documentation is always welcome:
[oracle@exadatadb01]$ ./rac-mon.sh -h
NAME
        rac-mon.sh - A quick and efficient RAC/GI 12c monitoring tool based on rac-status.sh (https://goo.gl/LwQC1N)

SYNOPSIS
        ./rac-mon.sh [-e] [-s] [-h]

DESCRIPTION
        rac-mon.sh needs the rac-status.sh script to be downloaded and working (https://goo.gl/LwQC1N)

        rac-mon.sh executes rac-status.sh and compares it with a previously taken good status of your cluster
        If no previous status exists, you will be prompted to create it with the command to do so.

        If rac-mon.sh finds differences betwen the current status of the cluster and the good status in the reference file,
        you will be told about and rac-mon.sh will exit 1. If no difference found, you will be told about and rac-mon.sh will exit 0.

        rac-mon.sh can also send emails about this depending on the -e and -s option as well as the EMAIL_ON_FAILURE and EMAIL_ON_SUCCESS variables.

OPTIONS
        -e      Sends an email to the email(s) defined in the EMAILTO parameter if an issue has been detected in the cluster
        -s      Sends an email to the email(s) defined in the EMAILTO parameter on success (even if no error has been detected)

                If you want to modify the script default to always send emails and not have to specify -e or -s,
                just change the values of these parameters on top of the script like this:
                        EMAIL_ON_FAILURE="Yes"
                        EMAIL_ON_SUCCESS="Yes"

        -h      Show this help
[oracle@exadatadb01]$

9/ Download rac-mon.sh


This is a pretty easy and cool way to monitor all the resources of a RAC/GI 12c/18c cluster, let me know if you like it !

Lost entries in oratab after GI 12.2 upgrade or patch

I first faced this issue when upgrading a GI to 12.2. My ASM entries in /etc/oratab were gone after the upgrade, I have then added them back manually. I first thought of a bug but after many upgrades, I thought about a new feature and how Flex ASM works came back to my mind.
Indeed, as with Flex ASM any ASM instance may move to any other nodes of a cluster, it makes sense to not have it hardcoded in the /etc/oratab file. The drawback of this is that oraenv doesn't work any more and this is an issue (at least for me as I use it a lot -- a lot more than a Flex ASM instance moves to another node . . .).

Starting from 12.2, ASM is configured as Flex ASM , this is why we have to set the Flex ASM Cardinality to "ALL" when upgrading GI to 12.2 for example.

This lost entries in oratab behavior is a consequence of this and is officially documented in the MOS note "Applying 12.2.0.1.171017 RU (patch 26737266) To 12.2 Cluster Removes Oratab Entries (Doc ID 2329359.1)" where we can learn more on this:

  • This is an expected behavior starting from 12.2.0.1.171017 GI RU/PSU (patch 26737266) and 12.2.0.1.171017 OCW RU/PSU (patch 26729536).
  • As patches are cumulative, all subsequent patches will also remove your entries from oratab

This note also provides a detailed explanation on the exact behavior of this feature:
When an agent starts up, it removes 12.2 ASM and database entries from /etc/oratab that have comments "# line added by Agent" appended to the line.
Surprisingly, it removes the oratab entries based on the "# line added by Agent" comment !

This is good to know though as we can then easily work that around by removing or modifying this comment in the /etc/oratab file like shown below where all these lines would survive a GI 12.2 upgrade / patch:
[oracle@exadatadb01 ~]$ cat /etc/oratab
myprod:/u01/app/oracle/product/12.1.0.2/dbhome_13:N              # please don't remove me
anotherprod:/u01/app/oracle/product/12.1.0.2/dbhome_1:N
+ASM1:/u01/app/oracle/grid/12.2:N                                # I want to stay in oratab
[oracle@exadatadb01 ~]$

and continue to enjoy oraenv !


This trick saved me a lot of time, hope you'll like it !

Efficiently purge / rotate all the Oracle logfiles

Almost every time I connect on a new client server, I find that the Oracle logfiles are not properly and/or not totally purged which, one day or another, leads to a FS > XX % which triggers a page, wake a DBA up, etc ...
I must admit that the Oracle logfile management may be confusing and this is what this blog is meant for: to make the Oracle logfile management clear and offer few short scripts to efficiently purge / rotate all the Oracle logfiles once for all.

1/ A brief history of the Oracle logfile management

Before 11g, all logfiles were text based and Oracle had no mechanism to purge / rotate its logfiles which used to trigger endless discussions between the DBA and the Sys Admin :


From 11g onwards, Oracle manages its logfiles in XML format, its tracefiles as .trc and .trm files and these ones are purged by a tool named ADR (Automatic Diagnostic Repository). I guess we all thought that this new feature would resolve all our previous troubles related to the logfiles and well ... not really. Indeed, Oracle also maintains text based logfiles (like the before 11g logfiles) and audit files which are both are not managed by ADR. Also worth mentioning that the Grid Infrastructure has a slightly different behavior.

2/ What logfiles are managed by ADR

Let's start by summing up of what is purged / rotated by ADR in the below table:
ComponentXML and *.tr[cm] logfilesText based logfilesAudit files
Database Homes Yes No No
GI Homes Yes, for some No No

Not that much, huh ? I do agree and this is not a bug but a feature as documented in "Adrci Purge Does Not Clear the Text-formatted Alert.Log located in the Trace Folder (Doc ID 751082.1)" and we'll be talking about the orange remark later on.


3/ Logrotate to complete ADR

It is clear from the above table that ADR needs help to finally purge / rotate all the Oracle logfiles and then to have a Yes in each cell of the table.
I strongly recommend using logrotate and in some case a bit of shell in a crontab. Indeed logrotate is :
  • Available on any Unix
  • Easy to learn
  • Well documented
  • Most likely already running on your system so you only have to add a small configuration file in /etc/logrotate.d for the Oracle logfiles and you are good to go !
  • . . . name it . . .
Before jumping in a simple logrotate config file, let's remind that the non-ADR managed logfiles are located in a directory pointed by the Oracle parameter diagnostic_dest:
SQL> show parameter diag
NAME                                     TYPE       VALUE
------------------------------------ ----------- ------------------------------
diagnostic_dest                         string     /u01/app/oracle
SQL>
And you'll find the text based Oracle logfiles subdirectories which are built as below:
<diagnostic_dest>/diag/<component>/<DB_UNIQUE_NAME>/<INSTANCE_NAME>/trace/*.log   -- for a database
<diagnostic_dest>/diag/<component>/<HOSTNAME>/<LISTENER_NAME>/trace/*.log         -- for a listener
On a well standardized system, you'll then find ALL these trace files to rotate with a simple command:
[oracle@exadatadb01]$ ls /u01/app/oracle/diag/*/*/*/trace/*.log
. . .
[oracle@exadatadb01]$
We can then purge / rotate ALL these files in a few lines logrotate config file:
[oracle@exadatadb01]$ cat oracle
/u01/app/oracle/diag/*/*/*/trace/*.log
    {
      daily                <= Consider rotating the logs every day
      rotate 7             <= Keep 7 versions before purging
      compress             <= Compress the rotated logs
      copytruncate         <= Copy and truncate the logfiles to keep the same inode
      missingok            <= Do not raise any alert if logrotate finds no logfile
      nodateext            <= Put a number instead of a date as extension
      size 20M             <= Rotate the logfile if it is bigger than 20 M
   }
[oracle@exadatadb01]$
This is an example, logrotate can rotate weekly, monthly, keep 60 versions of the rotated logs, etc . . . I personally like the size based rotation but it is totally up to you. What is important here is that you will purge all the text base trace files in few lines only. And as we used some "*" in the path, any new database trace files will be taken care by logrotate with no required action from anyone.

4/ The Database Homes

Now than we saw a simple logrotate config file, let's detail every case and see how it can apply.

4.1/ XML logfiles, *.tr[cm] logfiles

As we saw previously, the database Homes XML logfiles are automatically managed by ADR, you just have to set the SHORTP_POLICY And LONGP_POLICY in ADR to fit your needs and unless you hit a bug, the XML and trace files (*.tr[cm]) will be purged automatically.

4.2/ Text based logfiles

These ones have to be purged by you then as we saw previously, I recommend using logrotate to easily purge and rotate them then a simple config file like this one would do the job for all the databases, for all potential listeners running on your Database Homes and also for all coming databases as you may use the same diagnostic_dest directory for all the databases:
[oracle@exadatadb01]$ cat oracle
/u01/app/oracle/diag/*/*/*/trace/*.log
    {
      daily     
      rotate 7  
      compress  
      copytruncate
      missingok   
      nodateext   
      size 20M   
   }
[oracle@exadatadb01]$

4.3/ Audit files

You have to manually purge the audit files; they are pointed by the audit_file_dest Oracle parameter:
SQL> show parameter audit_file_dest
NAME                                 TYPE         VALUE
------------------------------------ ----------- ------------------------------
audit_file_dest                      string      /u01/app/oracle/admin/DB_NAME/adump
SQL>
Same as previously, as you may have everything well standardized on your system, you can find ALL the audit files on a server with a simple command:
[oracle@exadatadb01]$ find /u01/app/oracle/admin/*/adump
. . .
[oracle@exadatadb01]$
And you will purge them with a single command as well (the below example purges the audit files older than 7 days, modify it to suit your needs):
[oracle@exadatadb01]$ find /u01/app/oracle/admin/*/adump -type f -name '*.aud' -mtime +7 -delete
[oracle@exadatadb01]$
You can integrate this purge in the logrotate config file in a firstaction or lastaction section as below:
[oracle@exadatadb01]$ cat oracle
/u01/app/oracle/diag/*/*/*/trace/*.log
    {
      daily     
      rotate 7  
      compress  
      copytruncate
      missingok   
      nodateext   
      size 20M   
      lastaction
          find /u01/app/oracle/admin/*/adump -type f -name '*.aud' -mtime +7 -delete
      endscript
   }
[oracle@exadatadb01]$
The only thing is that the firstaction / lastaction logrotate parts are executed only if logrotate finds a logfile to rotate so in case it doesn't (in my example if one day there is no logfile bigger than 20MB to rotate), the audit files won't be purged. It may or may not be an issue for you but I recommend using a crontab script for these audit files to be 100% sure they are purged every day as you may have a lot of these files. To cron it, I personally prefer copying a small script in /etc/cron.daily/ than using the crontab. Indeed, I find it more handy.
[root@exadatadb01 ~]# cat /etc/cron.daily/oracle
#!/bin/bash
# Fred Denis -- September 5th 2018
# Delete more than 3 days old audit files
#

find /u01/app/oracle/admin/*/adump -type f -name '*.aud' -mtime +3 -delete
[root@exadatadb01 ~]# 

5/ The GI Homes

If you run a GI, you'll also have to take care of the GI's logfiles on top of the database Homes's one.

5.1/ XML logfiles, *.tr[cm] logfiles

From 11g onwards, the GI logfiles are XML based and the purge setting is set in ADR but there is no automatic process to run the purge as documented in "How to purge GI files from ADR HOME in 12.1.0.2 and above (Doc ID 1969131.1)" (I have to confess that I fell from my chair when I first discovered this). We then have to manually execute the ADRCI "purge" command in order to delete these trace files. As specified in the previous MOS note:
The correct way and only supported way to do this removal is with the ADRCI command line utility's PURGE command.  (It might be tempting to do it with a native Operating System command such as UNIX 'rm', but doing it that way does not provide the proper coordination with other programs that are using the ADR home.)
I did some research on the subject and I found that it is indeed documented in the 11g, 12c and 18c documentation:
Some Oracle products, such as Oracle Database, automatically purge diagnostic data at the end of its life cycle. Other products and components require you to purge diagnostic data manually with this command. You can also use this command to purge data that is due to be automatically purged.
It may look kind of mysterious but Note 1969131.1 is a bit more precise about the "Other products . . . require you to purge diagnostic data manually with this command.":
Unlike the Oracle database, GI does not have a background process that purges old ADR data automatically.  All GI daemons use a trace file rotation scheme that limits each daemon to a fixed total amount of trace data, but command line programs (such as crsctl) do not.
Note: You may find more details on how the GI deamons manage their logfiles size-based rotation in this documentation

After checking on my GI Homes, I found that ASM and MGMT ONLY are automatically purged so not the CRS home nor any listener nor anything else (you can see those who are automatically purged checking the LAST_AUTOPRG_TIME column from adrci show control).
This then explains why the below notes are indeed bugs as ASM automatic purge is supposed to work:
  • ADR Auto Purge Not Working In ASM Instance (Doc ID 1191704.1)
  • Bug 9530322 - ADR auto purge does not occur in ASM instance or standby database (Doc ID 9530322.8)

Having said that, it is clear that GI does not automatically purges all its logfiles and as you want to go with a supported solution, you have to schedule a purge command to run on a regular basis for every GI ADR home except those that are GI daemon based and . . . there's quite a few as shown on the below example:
[grid@exadatadb01 ~]$ adrci 
ADRCI: Release 12.1.0.2.0 - Production on Sun Nov 4 18:35:52 2018
Copyright (c) 1982, 2014, Oracle and/or its affiliates.  All rights reserved.
ADR base = "/u01/app/grid"
adrci> show home
ADR Homes: 
diag/asmtool/user_root/host_2411203453_82
diag/asmtool/user_grid/host_2411203453_82
diag/asm/+asm/+ASM1
diag/crs/exadatadb01/crs
diag/tnslsnr/exadatadb01/listener_scan1
diag/tnslsnr/exadatadb01/listener
diag/tnslsnr/exadatadb01/listener_scan3
diag/tnslsnr/exadatadb01/listener_scan2
diag/clients/user_root/host_2411203453_82
diag/clients/user_grid/host_2411203453_82
diag/clients/user_oracle/host_2411203453_82
adrci> 

I found no exhaustive list of daemon based GI component and as I do not want to have some ADR homes hard coded in case of another component comes into play one day or another, I then use these 2 lines to execute a "purge" on all the ADR homes:
ASM_OWN=`ps -ef | grep pmon | grep asm | awk '{print $1}'`
su - $ASM_OWN -c '. oraenv <<< `ps -ef | grep pmon | grep asm | sed s"/^.*+/+/" | head -1` > /dev/null; for A in `adrci exec="show home" | grep -v "ADR Homes:"`; do adrci exec="set home $A; show home; purge -age 10080;"; done'
Note: I save the ASM instance owner (which is the GI installation owner) and then su to it as I run all the purge scripts as root
Note 2: I force a "purge -age 10080" (10080 being the default) as I found that a simple "purge" was not working properly in some cases
Note 3: you may want to "grep -v ASM | grep -v MGMT" as they are both supposed to be automatically purged but I personally haven't for few reasons:
  • I found no exhaustive list of daemon based GI component so I may miss one even if I "grep -v ASM | grep -v MGMT"
  • A patch or upgrade may add or remove one daemon based GI component
  • An extra purge of these Homes won't hurt
  • I also found many bugs related to these purges not happening that these extra purges may be very beneficial at the end of the day

I can now include this purge in my /etc/cron.daily/oracle cron script:
[root@exadatadb01 ~]# cat /etc/cron.daily/oracle
#!/bin/bash
# Fred Denis -- September 5th 2018
# Delete more than 3 days old audit files
#

find /u01/app/oracle/admin/*/adump -type f -name '*.aud' -mtime +3 -delete

# Added the GI XML and *.tr* files to be purged using adrci purge as specified in 
# How to purge GI files from ADR HOME in 12.1.0.2 and above (Doc ID 1969131.1)	

ASM_OWN=`ps -ef | grep pmon | grep asm | awk '{print $1}'`
su - $ASM_OWN -c '. oraenv <<< `ps -ef | grep pmon | grep asm | sed s"/^.*+/+/" | head -1` > /dev/null; for A in `adrci exec="show home" | grep -v "ADR Homes:"`; do adrci exec="set home $A; show home; purge -age 10080;"; done'

5.2/ Text based logfiles

For the text base logfiles, same as for the databases, we can list them all checking the diagnostic_dest parameter:
SQL> show parameter diag
NAME				     TYPE	 VALUE
------------------------------------ ----------- ------------------------------
diagnostic_dest 		     string	 /u01/app/grid
SQL>
And then get all the logfiles to rotate using few stars in the path:
[grid@exadatadb01 ~]$ ls /u01/app/grid/diag/*/*/*/trace/*.log
. . .
[grid@exadatadb01 ~]$
And we just have to add the path to the already made logrotate config file for the database Homes:
[oracle@exadatadb01]$ cat oracle
/u01/app/oracle/diag/*/*/*/trace/*.log /u01/app/grid/diag/*/*/*/trace/*.log
    {
      daily     
      rotate 7  
      compress  
      copytruncate
      missingok   
      nodateext   
      size 20M   
   }
[oracle@exadatadb01]$
And you are done !

5.3/ Audit files

Same as previously, let's check the ASM audit_file_dest parameter:
SQL> show parameter audit_file
NAME				     TYPE	 VALUE
------------------------------------ ----------- ------------------------------
audit_file_dest 		     string	 /u01/app/12.1.0.2/grid/rdbms/audit
SQL> 
And add a find command to purge then in the already existing /etc/cron.daily/oracle cron script:
[root@exadatadb01 ~]# cat /etc/cron.daily/oracle
#!/bin/bash
# Fred Denis -- September 5th 2018
# Delete more than 3 days old audit files
# This is on top of the logrotate configuration which is in /etc/logrotate.d/oracle
#

find /oracle/*/admin/*/adump -type f -name '*.aud' -mtime +3 -delete
find /u01/app/12.1.0.2/grid/rdbms/audit -type f -name '*.aud' -mtime +3 -delete

# Added the GI XML and *.tr* files to be purged using adrci purge as specified in 
# How to purge GI files from ADR HOME in 12.1.0.2 and above (Doc ID 1969131.1)	

ASM_OWN=`ps -ef | grep pmon | grep asm | awk '{print $1}'`
su - $ASM_OWN -c '. oraenv <<< `ps -ef | grep pmon | grep asm | sed s"/^.*+/+/" | head -1` > /dev/null; for A in `adrci exec="show home" | grep -v "ADR Homes:"`; do adrci exec="set home $A; show home; purge -age 10080;"; done'
[root@exadatadb01 ~]# 
Easy peasy !

6/ Sum up

6.1/ Table

Let's now have a look at what the table on top of this document now looks like (How are the Oracle logfiles purged / rotated):
Component XML and *.tr[cm] logfiles Text based logfiles Audit files
Database Homes ADR /etc/logrotate.d/oracle /etc/cron.daily/oracle
GI Homes /etc/cron.daily/oracle /etc/logrotate.d/oracle /etc/cron.daily/oracle

An all green table is always better, isn't it ?

6.2/ Scripts

As a reference, please find the the scripts we built in this blog:

6.2.1/ /etc/logrotate.d/oracle

[root@exadatadb01 ~]# cat /etc/logrotate.d/oracle
/u01/app/oracle/diag/*/*/*/trace/*.log /u01/app/grid/diag/*/*/*/trace/*.log
    {
      daily     
      rotate 7  
      compress  
      copytruncate
      missingok   
      nodateext   
      size 20M   
   }
[root@exadatadb01 ~]#

6.2.2/ /etc/cron.daily/oracle

Please keep in mind that this script has to be executable (chmod u+x /etc/cron.daily/oracle)
[root@exadatadb01 ~]# cat /etc/cron.daily/oracle
#!/bin/bash
# Fred Denis -- September 5th 2018
# Delete more than 3 days old audit files
# This is on top of the logrotate configuration which is in /etc/logrotate.d/oracle
#

find /u01/app/oracle/admin/*/adump -type f -name '*.aud' -mtime +3 -delete
find /u01/app/12.1.0.2/grid/rdbms/audit -type f -name '*.aud' -mtime +3 -delete

# Added the GI XML and *.tr* files to be purged using adrci purge as specified in 
# How to purge GI files from ADR HOME in 12.1.0.2 and above (Doc ID 1969131.1)	

ASM_OWN=`ps -ef | grep pmon | grep asm | awk '{print $1}'`
su - $ASM_OWN -c '. oraenv <<< `ps -ef | grep pmon | grep asm | sed s"/^.*+/+/" | head -1` > /dev/null; for A in `adrci exec="show home" | grep -v "ADR Homes:"`; do adrci exec="set home $A; show home; purge -age 10080;"; done'

#********************************************************************************#
#			E N D      O F      S O U R C E				*#
#********************************************************************************#
[root@exadatadb01 ~]#

7/ A word on logrotate

Logrotate config files have to be owned by root and located in /etc/logrotate.d. I personally build my logrotate config file as oracle in /home/oracle and I copy it when ready:
[root@exadatadb01 ~]# cp /home/oracle/oracle /etc/logrotate.d/.

I recommend testing your logrotate config file before deploying them, you can test them (see everything that logrotate would do without doing it) with the -d option:
[oracle@exadatadb01 ~]$ logrotate -d oracle -s /tmp/ostatus
reading config file oracle
reading config info for /u01/app/oracle/diag/*/*/*/trace/*.log /u01/app/grid/diag/*/*/*/trace/*.log
. . .
[oracle@exadatadb01 ~]$
Note: You have to specifiy a status file with the -s option if you test tour logrotate config file as a non root user.

You may also want to force a logrotate execution with the -f option:
[root@exadatadb01 ~]# logrotate -f /etc/logrotate.d/oracle
. . .
[root@exadatadb01 ~]#
Note: logrotate will rotate every logfile even if it doesn't think it is necessary

7/ If you have RAC / Exadata

These purge / rotate configuration files / scripts act locally only so you have to deploy them on each node of your RAC / Exadata.


I hope you enjoyed this article and you could use it on your servers to totally remove the FS full pages due to the Oracle logfiles !

rac-status.sh : now shows the services (and more)

rac-status.sh now shows the services (and more)
Please find a screenshot below :


The services are not shown by default (default shows the listeners and the databases); you have 2 ways to modify the default behavior:
1/ Modify the default variables in the script :
  SHOW_DB="YES"                 # Databases
 #SHOW_DB="NO"
SHOW_LSNR="YES"                 # Listeners
#SHOW_LSNR="NO"
 SHOW_SVC="YES"                 # Services
 SHOW_SVC="NO"

2/ Use one of the option I implemented to show / hide part of the output depending on your needs; please find the usage function for information on how to use these options :
$ ./rac-status.sh -h

NAME
        rac-status.sh - A nice overview of databases, listeners and services running across a GI 12c

SYNOPSIS
        ./rac-status.sh [-a] [-n] [-d] [-l] [-s] [-h]

DESCRIPTION
        rac-status.sh needs to be executed with a user allowed to query GI using crsctl; oraenv also has to be working
        rac-status.sh will show what is running or not running accross all the nodes of a GI 12c :
                - The databases instances (and the ORACLE_HOME they are running against)
                - The type of database : Primary, Standby, RAC One node, Single
                - The listeners (SCAN Listener and regular listeners)
                - The services
        With no option, rac-status.sh will show what is defined by the variables :
                - SHOW_DB       # To show the databases instances
                - SHOW_LSNR     # To show the listeners
                - SHOW_SVC      # To show the services
                These variables can be modified in the script itself or you can use command line option to revert their value (see below)


OPTIONS
        -a        Show everything regardless of the default behavior defined with SHOW_DB, SHOW_LSNR and SHOW_SVC
        -n        Show nothing    regardless of the default behavior defined with SHOW_DB, SHOW_LSNR and SHOW_SVC
        -d        Revert the behavior defined by SHOW_DB  ; if SHOW_DB   is set to YES to show the databases by default, then the -d option will hide the databases
        -l        Revert the behavior defined by SHOW_LSNR; if SHOW_LSNR is set to YES to show the listeners by default, then the -l option will hide the listeners
        -s        Revert the behavior defined by SHOW_SVC ; if SHOW_SVC  is set to YES to show the services  by default, then the -s option will hide the services
        -h        Shows this help

        Note : the options are cumulative and can be combined with a "the last one wins" behavior :
                $ ./rac-status.sh -a -l              # Show everything but the listeners (-a will force show everything then -l will hide the listeners)
                $ ./rac-status.sh -n -d              # Show only the databases           (-n will force hide everything then -d with show the databases)

                Experiment and enjoy  !


I also have implemented few cool things with this update :
  • Short names for hostnames are now shown in the tables' headers instead of the whole hostnames (when possible); this makes the output more visible
  • The name of the cluster is now shown on top of the tables
  • The columns are dynamically adjusted to keep everything aligned depending on the largest information we show
  • The columns where are shown the status are adjusted depending on how many nodes you have -- indeed, in the case of a full rack we have many information to show
  • In the case of many ports listened by some listeners, they are shown outside of the table after the last column to not mess up the nice alignment then it stays clear
  • Databases names are now left aligned, the center alignment was not really clear
  • I have shorten some status like "Shutdown" instead of "Instance Shutdown" or "Readonly" instead of "Open,Readonly" then it stays clear and take less room on the screen (very nice for big implementations)
  • Try and experiment the options, you can combine them to show what you want regardless of the default defined in the script, it is very handy !

The original post on rac-status.sh is still valid with a detailed description on how to use this script. You can also still download rac-status.sh here

Enjoy ! and please let me know if you find any bug or have any question.

rac-status.sh : now shows the listeners as well

rac-status.sh now shows the listeners as well !

Please find a screenshot below :


The original post on rac-status.sh is still valid with a detailed description on how to use this script. You can also still download rac-status.sh here

Enjoy !

rac-on_all_db.sh : easily execute a query on all the databases


Any DBA has already faced at least once this kind of Friday 5pm manager's call :

- Manager  : "hey, could you please give me the value of the parameter XXXX on all the databases running on the production / dev cluster ?"
- DBA         : "well yes... now ?"
- Manager  : "yes, it is very urgent, blabla . . ."

Whatever the reason this kind of demand suddenly becomes very urgent on a Friday afternoon and whatever is the parameter, you want to get the information as quickly as possible to head on a well deserved week-end.

Assuming you use rac-status.sh, you can then quickly know where all the databases instances are running like shown on the below output :


We can see on the above output that the db01 database has an instance opened on the node 3, the db02, db03 and db04 databases have an instance opened on the node 1, db05 has an instance available on node 3, etc...

A way to proceed to achieve the manager's request would then be to :
  1. ssh to the node where an instance is running 
  2. set the correct environment (. oraenv)
  3. connect as sqlplus
  4. execute the SQL to check the parameter value (select name, value from v$parameter . . .)
  5. get the database name and the parameter value and paste it in a nice output
And these 5 steps have to be done for each database which can be quite painful if you have many databases running which is most likely the case for any RAC / Exadata environment.


This is to achieve this that I wrote the rac-on_all_db.sh script. Indeed, it will do all the above steps for you and make a nice output ready to copy and paste or screenshot :


Nice and easy, isn't it ?

And to customize the SQL you want to execute against all the databases, simply edit the script and insert the SQL you want in this section :


Et voila !


There're few small prerequisites to be able to run this script :
  • oraenv should be working on each database node 
  • The script should be executed as the owner of the databases (oracle)
  • The user that executes the script must have his ssh key deployed to all the other database nodes (this is a prerequisite for a RAC installation then it should already been done on your configuration)


Feel free to download the code and I hope you'll be enjoying this script as much as I do !


gridSetup.sh : ERROR: The home is not clean. This home cannot be used. . .

Oracle 12c introduced an awesome feature with gridSetup.sh to ease the Grid Infrastructure software management and it looks very good tool so far.
I wanted to share a behavior that may be interested to know when applying a PSU, let's have a look.


First of all, I have installed a GI 12.2 from a downloaded image :

[grid@exadata_db01 grid]$ unzip -q /software/oracle/V840012-01.zip -d /u01/app/12.2.0.1/grid
[grid@exadata_db01 grid]$


And I have then applied the Jan 2018 RU against this GI and got an error :

[grid@exadata_db01 grid]$ ./gridSetup.sh -applyPSU /software/oracle/27100009
ERROR: Unable to verify the graphical display setup. This application requires X display. Make sure that xdpyinfo exist under PATH variable.
Preparing the home to patch...
Applying the patch /software/oracle/27100009...
OPatch command failed while applying the patch. For details look at the logs from /u01/app/12.2.0.1/grid/cfgtoollogs/opatch/.
[grid@exadata_db01 grid]$ 

Note that here gridSetup.sh is very nice as I haven't set the -silent option but as my X display is not detected (indeed I haven't forwarded my X11), gridSetup.sh continues forward here which is much appreciated.

I then had a look at the logfile and found that my opatch was obsolete and needed to be updated (actually, I messed up in the opatch update before starting the RU application) :

Prerequisite check "CheckMinimumOPatchVersion" failed.
The details are:
The OPatch being used has version 12.2.0.1.6 while the following patch(es) require higher versions:
Patch 27105253 requires OPatch version 12.2.0.1.7.
Please download latest OPatch from My Oracle Support.

I then updated opatch properly :

[grid@exadata_db01 grid]$ unzip -o /software/oracle/p6880880_122010_Linux-x86-64.zip -d /u01/app/12.2.0.1/grid
. . .

[grid@exadata_db01 grid]$ OPatch/opatch version
OPatch Version: 12.2.0.1.12

OPatch succeeded.
[grid@exadata_db01 grid]$ 

And restarted the Jan2018 RU application against my GI Home :

[grid@exadata_db01 grid]$ ./gridSetup.sh -applyPSU /software/oracle/27100009 -silent

ERROR: The home is not clean. This home cannot be used since there was a failed OPatch execution in this home. Use a different home to proceed.

[grid@exadata_db01 grid]$ 

What this error could really mean ? Well I found the note "Executing "gridSetup.sh" Fails with "ERROR: The home is not clean" (Doc ID 2279633.1)" which gives us the solution :

The only way to get around this issue currently is to clean the contents out of that HOME (e.g. rm -Rf ), then re-unzip the Grid Infrastructure 12.2.0.1 Gold Image on local node into the NEW_GRID_HOME path as GRID_HOME user.

It clearly means that for any failed installation (even if due to a wrong opatch version), we'll have to remove the whole installation and re-install GI from scratch !
Please note that this behavior may change in the future as the "currently" suggests.

In the meantime, do not forget to create a Gold Image of your home before applying a patch !

[grid@exadata_db01 grid]$ ./gridSetup.sh -createGoldImage -destinationLocation /software/oracle/GI12.2_opatch_12.2.0.1.12 -silent
Launching Oracle Grid Infrastructure Setup Wizard...

Successfully Setup Software.
Gold Image location: /software/oracle/GI12.2_opatch_12.2.0.1.12/grid_home_2018-04-10_09-24-46PM.zip

[grid@exadata_db01 grid]$

Hope it helps !

Python venv

A lot of application running on our VMs use python. As python evolves a lot and is extensible through modules, it is very frequent that a u...